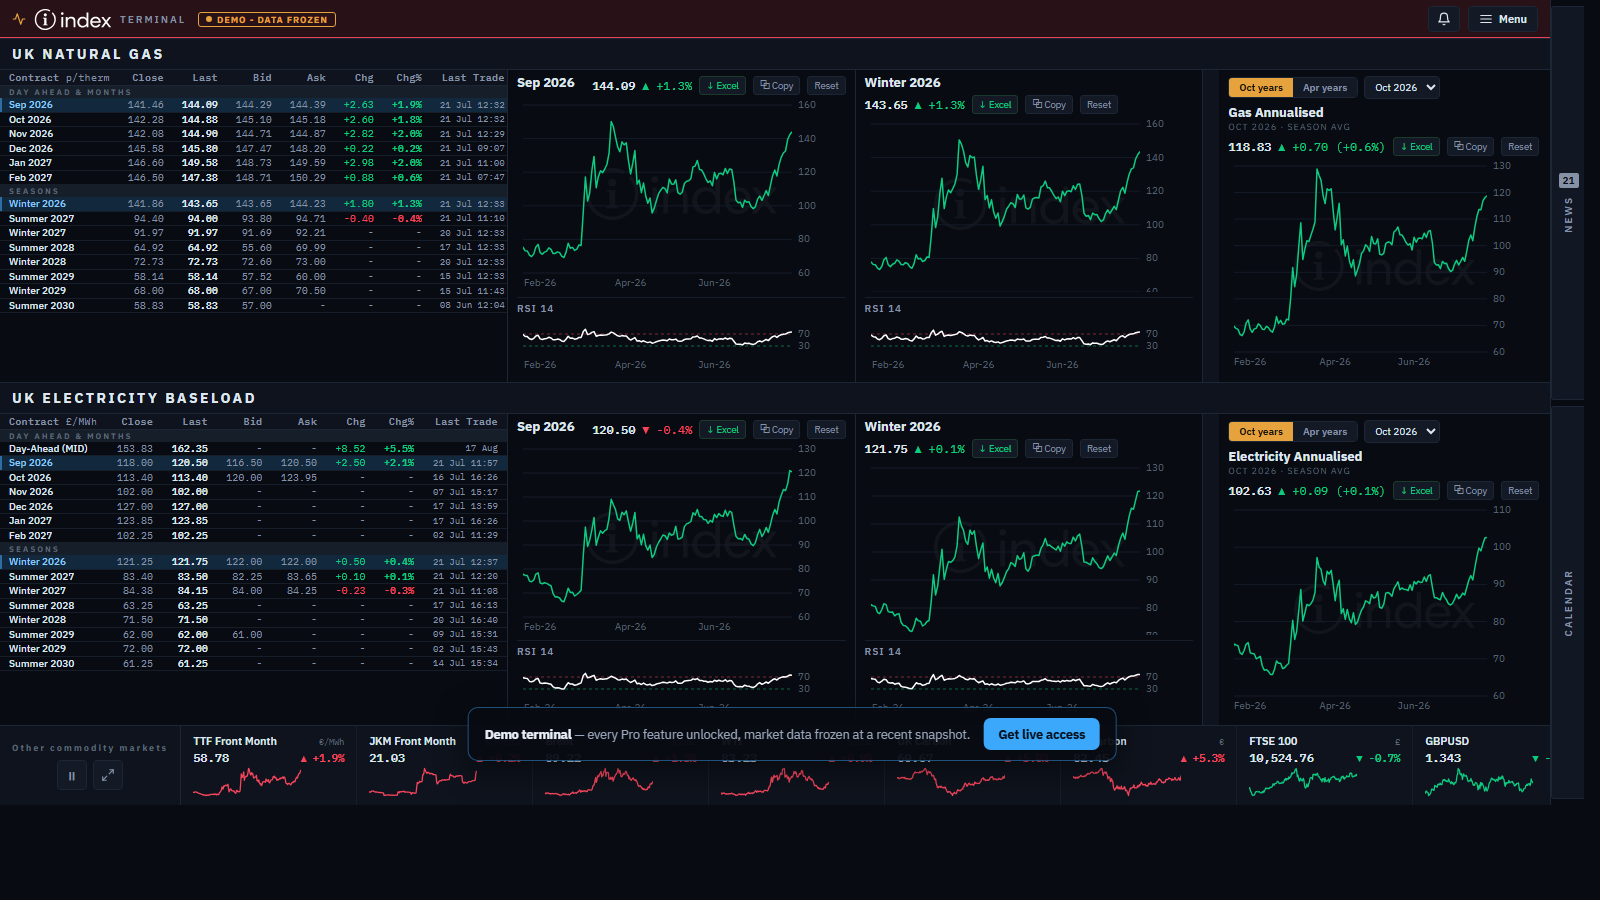
Both fuels, day-ahead to the back of the curve
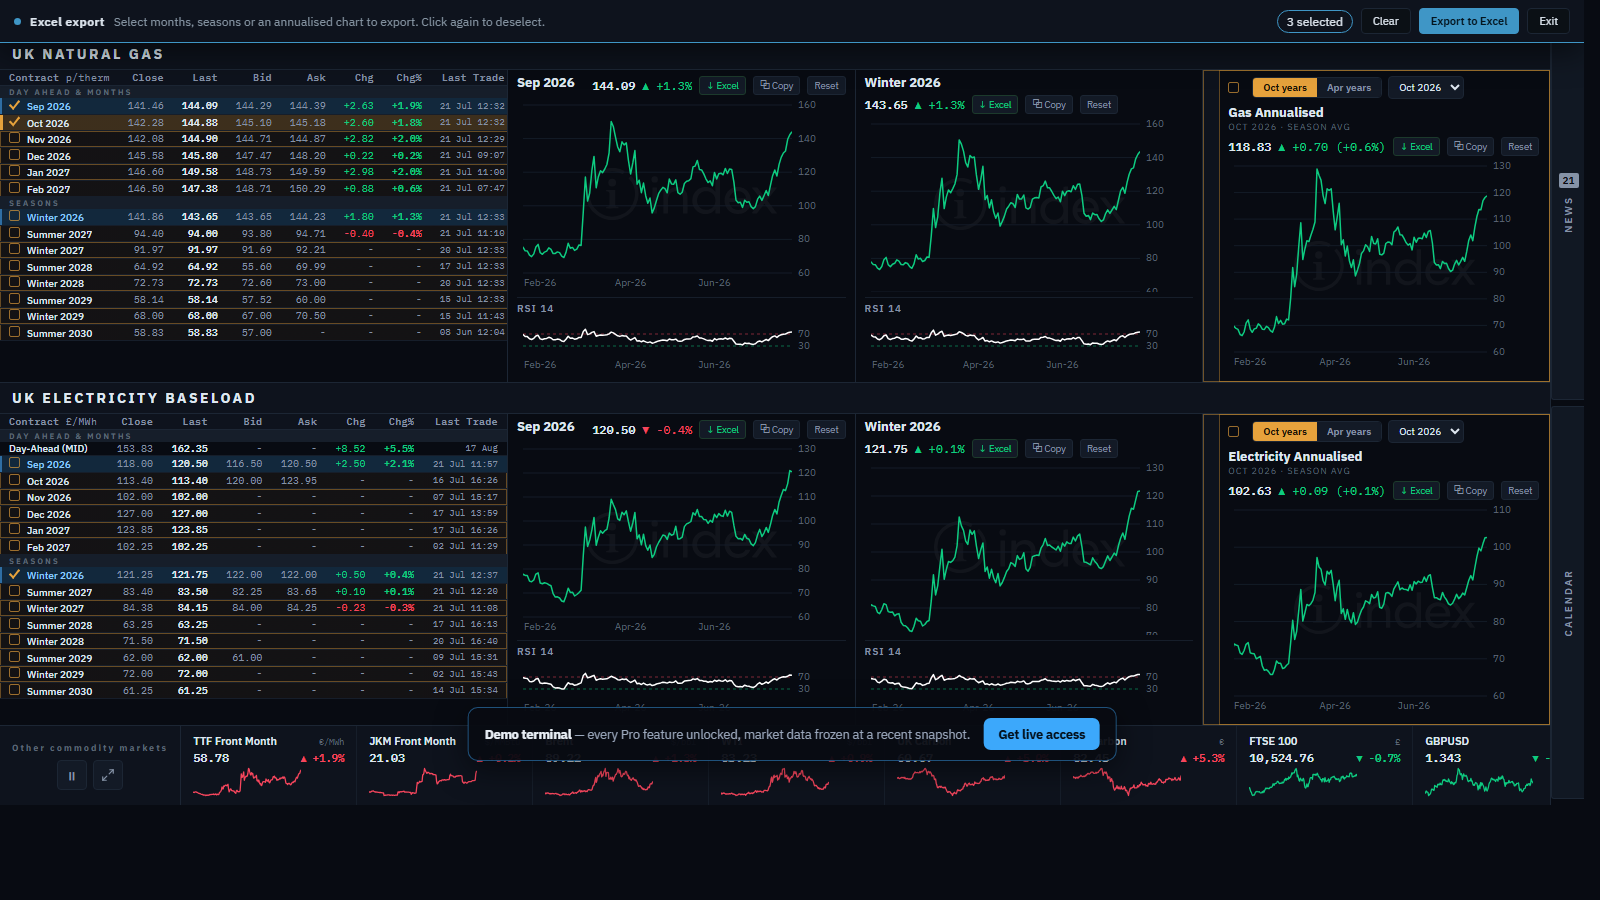
Live NBP gas and UK baseload power side by side: front months, eight seasons, day-ahead, annualised views, RSI under every chart, and one-click Excel and clipboard exports.
Intraday refresh through the trading day. Runs in the browser — nothing to install.
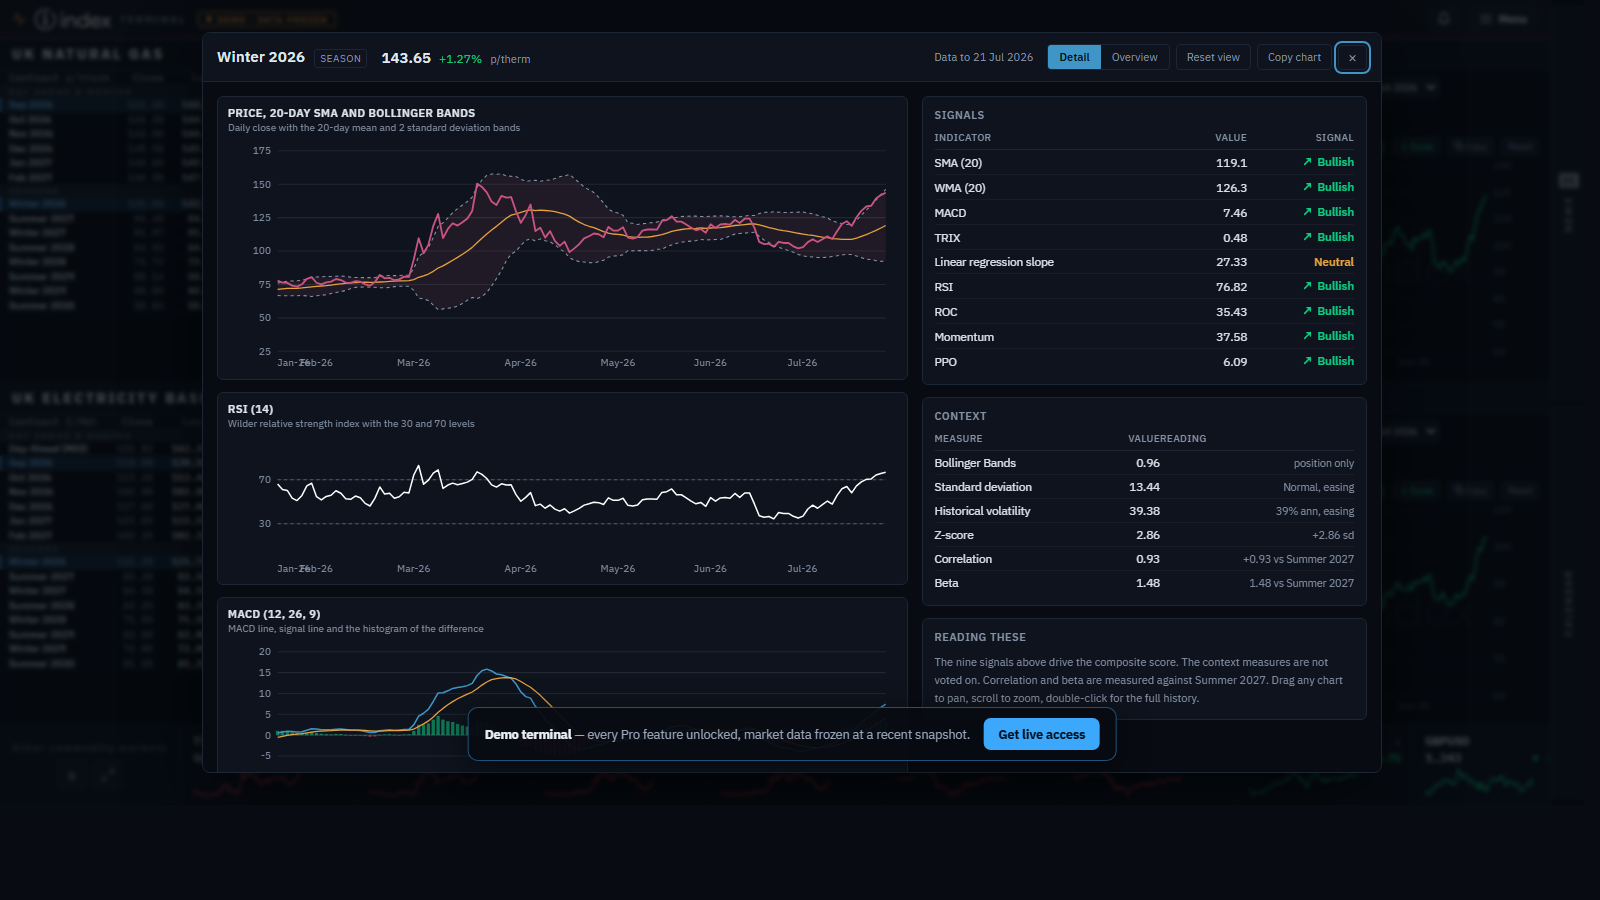
Technical analysis with a verdict
Right-click any contract for the full read: fifteen indicators computed on the series behind the chart, each with its own signal, rolled into a single verdict a client can understand.
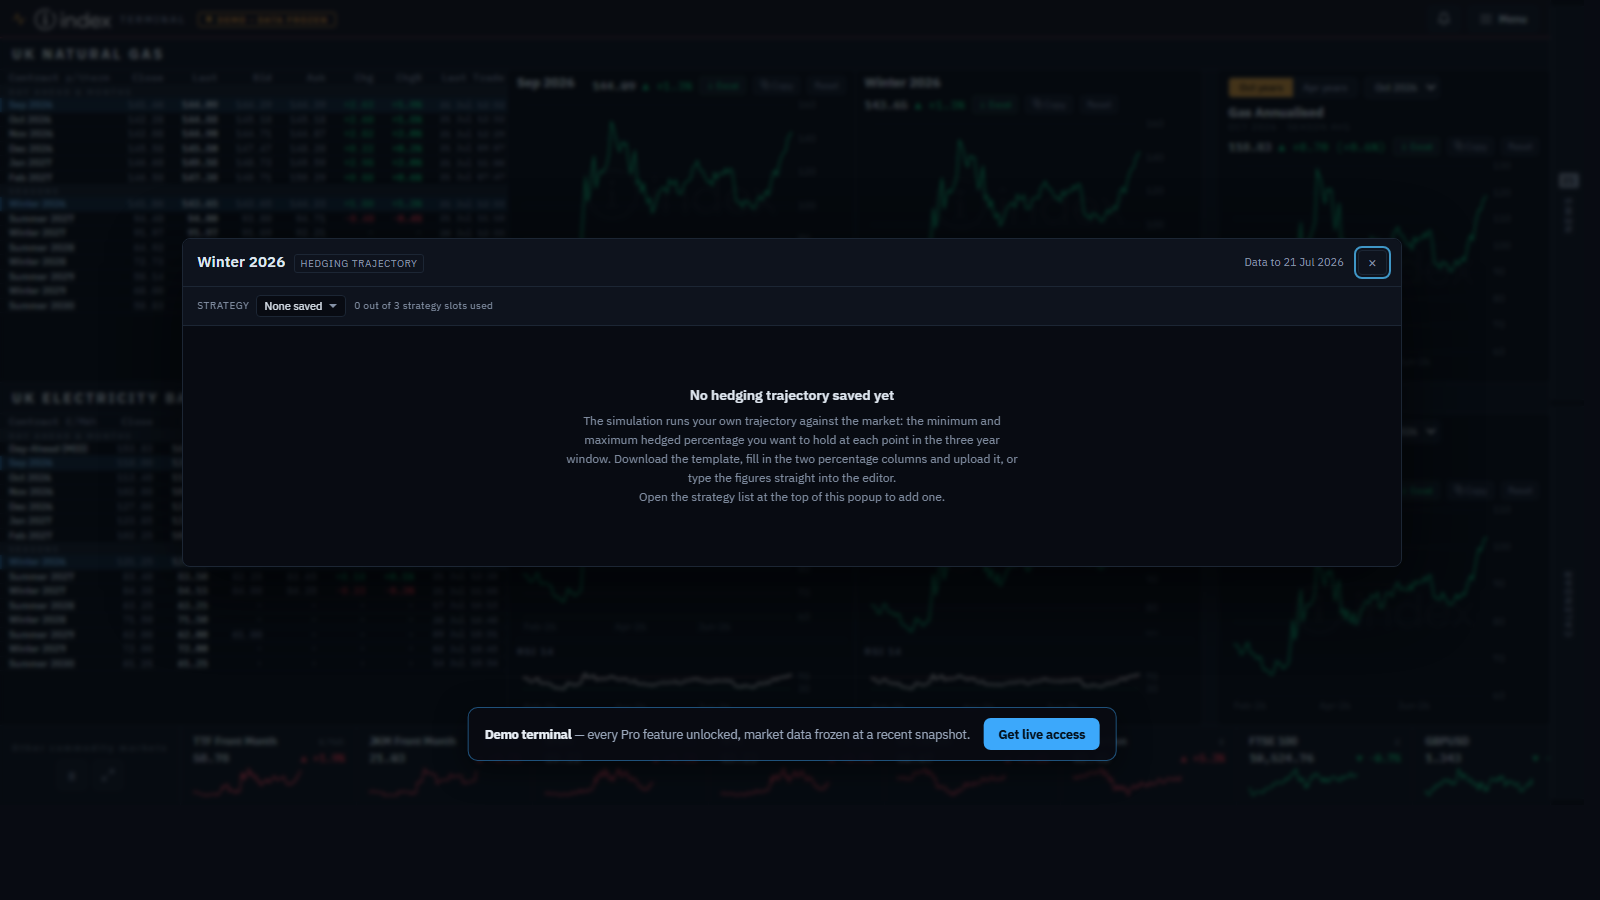
Simulate your own hedging trajectory
Upload or type the minimum and maximum hedged percentages your desk actually runs, and see what that policy would have achieved against the market and the flat average — per season or across a multi-year strip.
Trajectories save to your account. Spreadsheet template included.
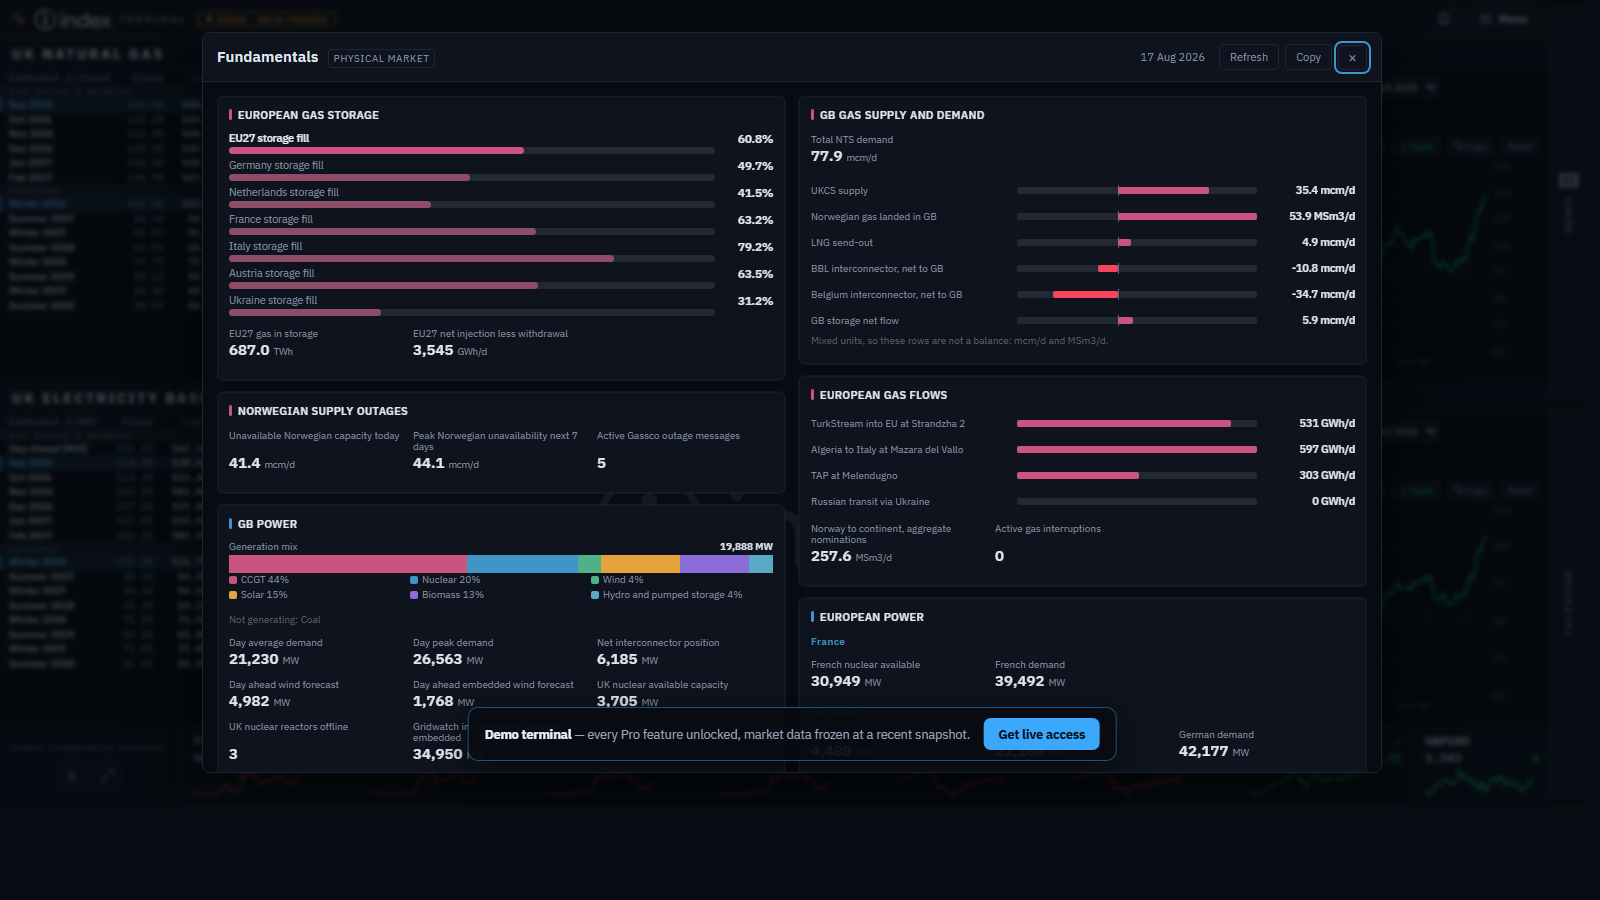
The physical picture behind the curve
One board for the fundamentals that move the price: European storage fill, GB supply and demand, continental flows, Norwegian outages, the generation mix, French and German power, Nordic hydro and carbon — refreshed daily.
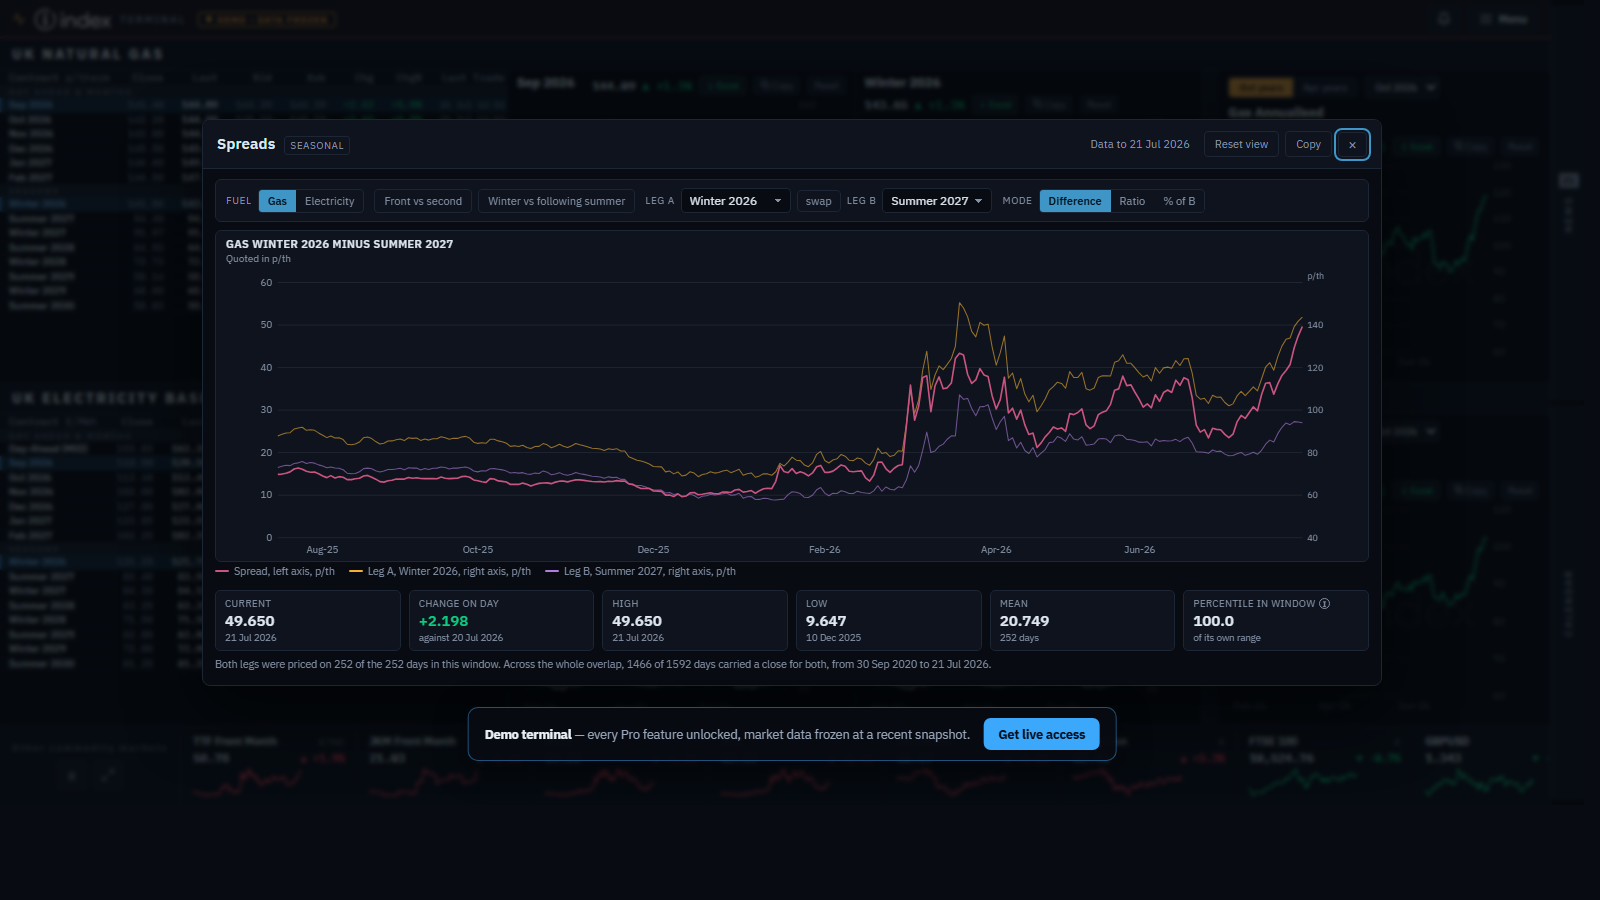
Spreads, seasonality and statistics
Any season against any season, winter-summer structure at a glance, percentile bands and full descriptive statistics — the questions a desk asks every morning, answered in two clicks.
Excel, the way your desk wants it
Tick months, seasons and annualised series across both fuels and export the lot into one worksheet with a shared date column. Plus & Pro add the client-ready position report: pick a delivery window, and consumption is spread on published seasonal normals.
See it with your own numbers
Plans from £299 per user per month, minimum 12-month term. Every user beyond your third is £150.